


The Dashboard is the first page Valkey® Admin opens after you connect. It sums up your Valkey server’s memory and activity in four cards, with detailed metrics and charts below.
The screenshots come from a local Valkey after a few Bookshop keys were added, so your numbers will differ.
Note: Every command and screen on this page is real, from Valkey Admin 1.3.0 connected to Valkey 9.1 on an Apple silicon Mac with macOS 26.
Prerequisites
- Valkey Admin connected to your Valkey server.
The Four Cards
Connect first if you haven’t (How to Connect Valkey Admin to a Valkey Server), then click Dashboard in the sidebar. The top row shows:


- Total Memory: the server’s memory limit, its maxmemory setting. ∞ means no limit is set.
- Used Memory: the memory Valkey uses now, 1.42 MB here.
- Operations: the total number of commands the server has processed.
- Hit Ratio: the share of key reads that found their key. 100.00% here: no read has missed.
The Metric Groups
Below the cards, the numbers from the server’s INFO command sit in seven groups: Memory Usage, Uptime, Replication & Persistence, Client Connectivity, Command Execution, Data Effectiveness & Eviction, and Messaging. Click a group to open it. Data Effectiveness & Eviction holds the numbers behind the hit ratio, Keyspace Hits and Keyspace Misses:

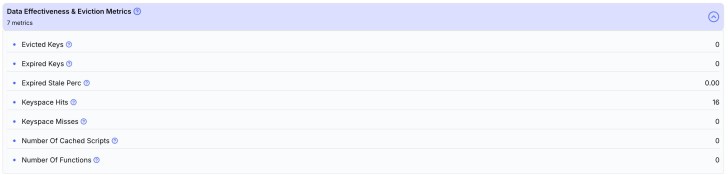
Type in Search metrics to find a metric by name across all groups.
The Charts
Further down, Metrics and Anomaly Detection draws memory, CPU and key metrics over time, one small chart each:


Click a chart’s expand icon to open it large. Here Keys Count rises from 1 to 3 as the book keys arrived:


Change Last 1 Hour at the top of an open chart to see a longer time range. Data available since shows when Valkey Admin started collecting, so a chart can’t go back further than that.
Common Mistakes
| Mistake | What happens | Do this instead |
|---|---|---|
| Reading ∞ under Total Memory as unlimited memory | ∞ only means Valkey has no maxmemory limit set. Your computer’s memory is still limited. | Set a limit with maxmemory, covered later in this tutorial in Part 22: Memory and Eviction |
| Expecting charts from before you connected | The charts start when Valkey Admin starts collecting | Check Data available since on an open chart |
FAQ
Why does Hit Ratio show a dash?
Right after you connect, before any key has been read, there are no hits or misses to compare, so the card shows a dash.
Where do these numbers come from?
Most come from the server’s INFO command, which Valkey Admin reads for you and groups by topic.
Conclusion
Read the four cards for a quick check, open a metric group for the details, and use the charts to see how memory and keys change over time.
Related
- Valkey Tutorial — Part 3: Valkey Admin for Beginners
- How to Connect Valkey Admin to a Valkey Server
- How to Browse and Edit Keys in Valkey Admin
- How to Run Valkey Commands in Valkey Admin
Additional Resources
Valkey® is a registered trademark of LF Projects, LLC. Redis® is a registered trademark of Redis Ltd. Any rights therein are reserved to Redis Ltd. Other names mentioned are trademarks of their respective owners. JD Bots isn’t affiliated with the Valkey project, LF Projects or Redis Ltd., and isn’t endorsed, supported or certified by them.